RISE WITH THE WHALES
Whale Trading Network
Premium TradingView indicators + an integrated Discord community for education, analysis, and disciplined decision‑making.
What we build
Controller‑driven, regime‑aware signals
Our signals coordinate momentum, structure, and context and actively manage when prints are allowed—reducing noise during downtrends and late‑stage rallies.
TradingView‑native workflow
Designed for decisive entries and disciplined continuation, calibrated across common timeframes.
Integrated Discord community
Our Discord is fully integrated with the WTN Technical Indicator and built around live education and actionable, regime‑aware signals. Members get real‑time alerts, personalized delivery for tickers they care about, weekly live sessions that review chart requests, and ongoing analysis from multiple technical‑analysis mentors.
Real‑time signals (WTN Technical Indicator → Discord)
- Alerts routed from the indicator for 4‑hour, 1‑day, and 5‑day charts.
- Technical‑analysis alerts plus red / green / gold dot events: flashing (in‑progress) and confirmed prints.
- Context‑aware delivery aligned to the indicator’s regime and permission logic.
Personalized ticker alert bot (opt‑in)
- Subscribe to the ticker alert bot to track specific assets.
- Receive selected signals directly—only for the tickers you choose.
- Fine‑grained control of channels and alert types so your feed stays relevant.
Weekly live video sessions
- Chart‑request walk‑throughs—members submit tickers, we review them live.
- Step‑by‑step reads: regime → positioning → momentum → oscillator → permissions.
- Recordings and key takeaways posted for follow‑up study.
Mentorship & ongoing analysis
- Multiple technical‑analysis mentors provide charts and notes throughout the week.
- Clarified examples of bottom setup, continuation, and early‑top context.
- Threaded feedback to help members improve timing, sizing, and risk controls.
This software and all associated content are provided for educational and informational purposes only and do not constitute financial, investment, or trading advice. You should always consult with a licensed financial advisor before making any financial decisions. Alerts, education, backtests, and examples are hypothetical and do not guarantee future performance, and past performance is not an indication of future results. Trading involves risk—always consider execution quality, fees, slippage, and your risk tolerance.
Performance
Backtest strategy setup
- Initial capital: $10,000
- Entry sizing: 100% of equity per buy
- Pyramiding: 50
- Sell management:
- Sell 50% of the entry using a tight stop‑loss
- Manage the remaining position with a loose stop‑loss generated by the indicator
Backtests are hypothetical and do not guarantee future performance. Actual results depend on execution quality, fees, slippage, asset‑specific behavior, and adherence to the strategy.
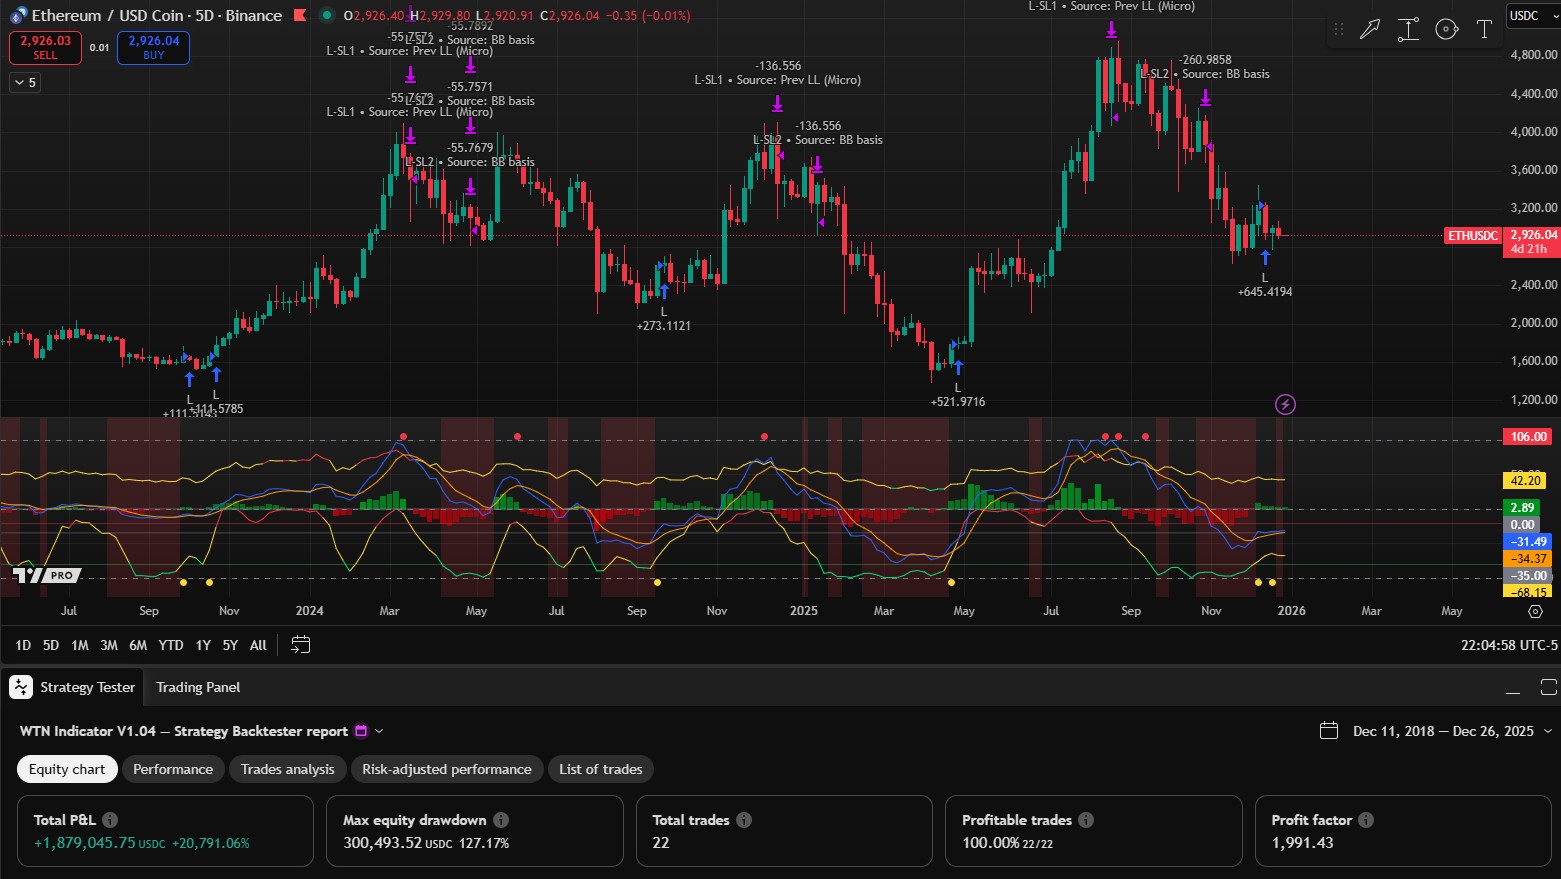
The backtest on the WTN Technical Indicator shows that the strategy started in 2018 buying ETH with a starting value of $10,000. Following the indicator resulted in 100% profitable trades (22/22) with a reported P&L of $1.87M in profits.
These results do not indicate future performance and there are no guarantees. Backtests are hypothetical and rely on assumptions about data quality, execution, fees, slippage, and adherence to the strategy.
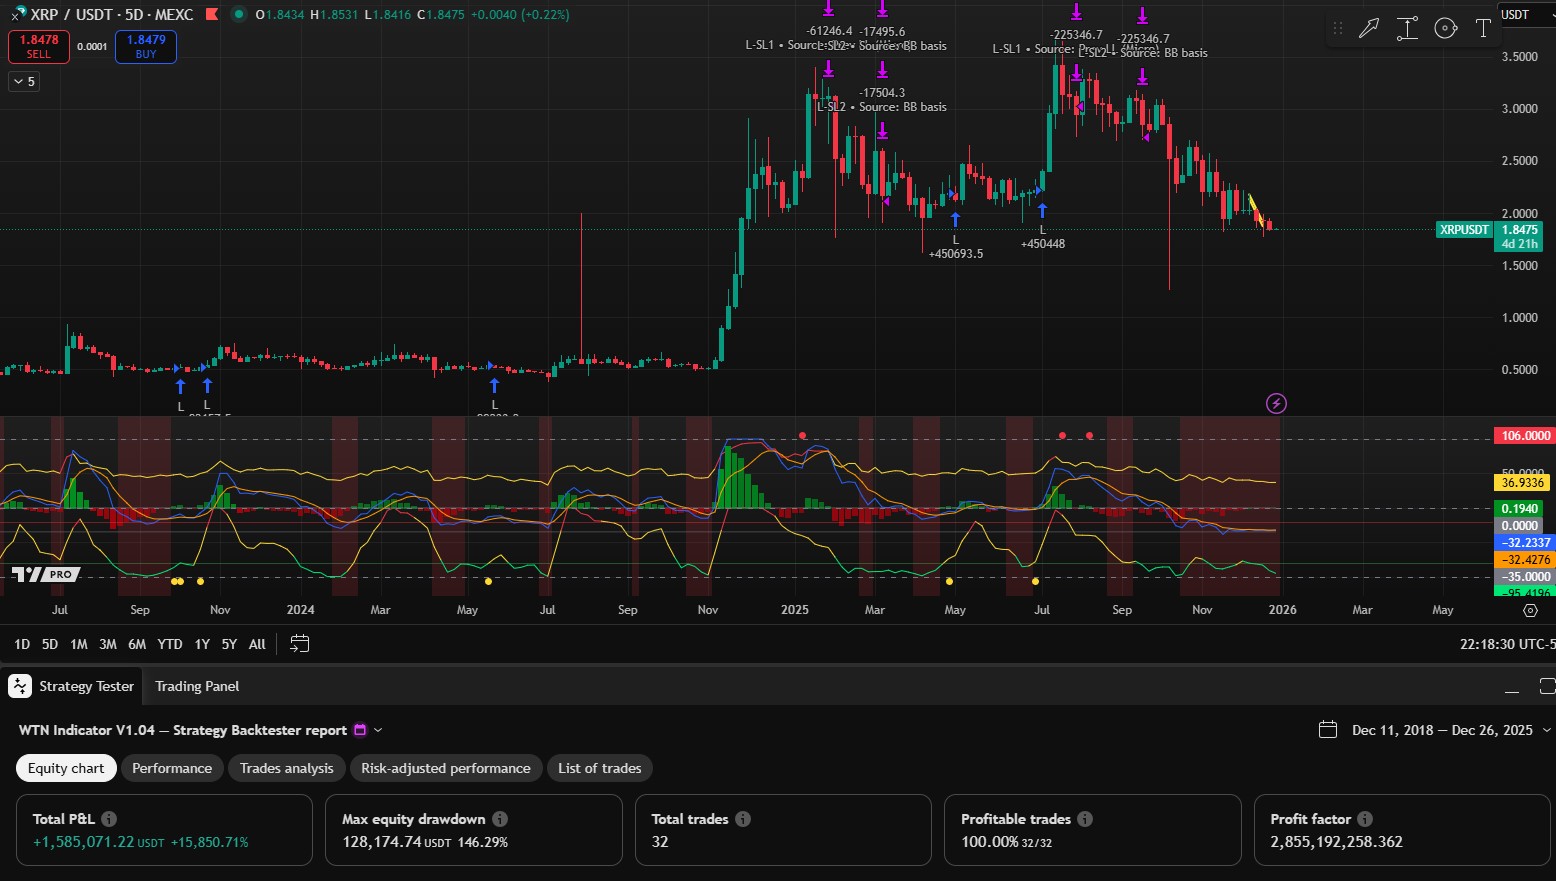
On XRP over the same period (Dec 11, 2018 – Dec 26, 2025), the backtest panel reports 32 total trades with 100% profitable trades (32/32) and a cumulative P&L of ≈ $1.585M. Drawdown and profit factor metrics appear in the report for context and risk assessment.
Backtests are hypothetical and do not guarantee future returns. Actual results depend on execution quality, fees, slippage, asset‑specific behavior, and adherence to the strategy.
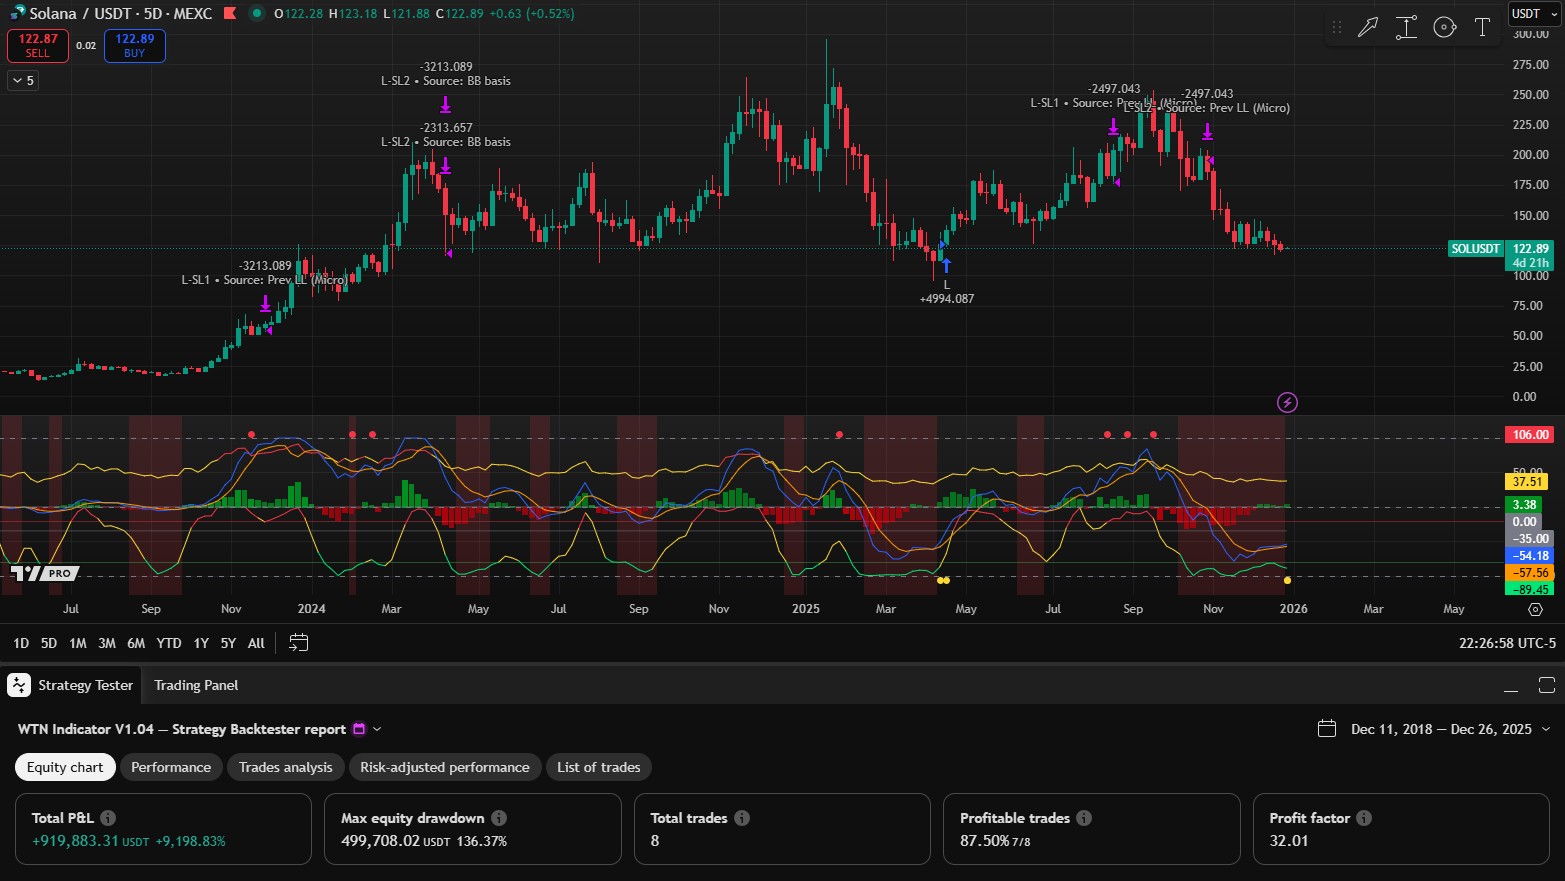
On Solana (SOL), the backtest report shows 8 total trades with 87.5% profitable trades (7/8) and a cumulative P&L of $919,883.31. The panel also reports a profit factor ≈ 32.01 and a max equity drawdown ≈ $499,708 (≈136.37%).
Backtests are hypothetical and do not guarantee future returns. Actual results depend on execution quality, fees, slippage, asset‑specific behavior, and adherence to the strategy.
Pricing
Chat Only
$5.00/mo
- Access to general, crypto, and stock chat
- Access to Twitter alerts for crypto and stocks
- Access to the educational section
- Access to the YouTube videos
Alert System
$15/mo
- Everything in Chat Only
- Access to subscribe to assets
- Access to the gold, green, and red dot channels
- Access to Member chat
Technical Indicator
$30/mo
- Everything in Chat Only & Alert System
- Access to the WTN Technical Indicator
Support
Get help
If you need technical support, email whaletradingnetwork@gmail.com or post a request in the support channel on Discord.
Build confidence. Trade with clarity.
Align your decisions with regime‑aware signals, normalized confluence, and continuation emphasis on higher frames.