INDICATOR · SPOT
WTN Technical Indicator
Used for spot buying. Green (bottom setups), Gold (continuations), Red (early top warnings). Controller‑governed permissions with down‑channel and top‑zone gates.
How it works
- Signals align momentum (MACD/histogram), oscillators (RSI/Stoch RSI), and structure (MAs/BBs) with context gates.
- Multi‑timeframe coordination: shorter frames for tactical entries, middle for swing validation, highest for continuation emphasis.
- Normalization keeps confluence consistent across assets/timeframes.
- Down‑Channel Latch & Top‑Zone Gate actively refuse late‑stage or impaired conditions.
Screenshots (TradingView)
Integrated Discord community
Our community is built around the indicator’s real‑time alerts with education‑first context: entries & continuation on 4‑hour, 1‑day, and 5‑day charts, plus detailed technical alerts and stop‑line guidance in every message.
Dot events (entries & risk)
- Green dots — confirmed & flashing on 4‑hour / 1‑day / 5‑day. Signals a tactical bottom/turn; includes momentum label, RSI zone, and suggested stop‑line.
- Gold dots — confirmed & flashing on 4‑hour / 1‑day / 5‑day (including weekly lookback pulse). Continuation after a recent Green; gate checks include Stoch RSI, Down‑Channel latch, and Fib gate where applicable.
- Red dots — confirmed & flashing on 4‑hour / 1‑day / 5‑day. Early‑top reversal with RSI/MACD confluence and optional oversold veto; arms staged stops in strategy mode.
- Stocks: Green/Gold/Red alerts on 4‑hour / 1‑day / 5‑day, including weekly Gold/Red on the 5‑day family with crypto‑parity gates.
Structure & price interaction alerts
- SMA levels (50/100/200) — breakout/breakdown above/below, wick rejection, and support wick, with a compact “above/below” snapshot and stop‑line guidance.
- Bollinger Basis — breakout/breakdown, wick rejection, and support wick (confirmed & flashing), with Basis price and band‑width diagnostics.
- Trend continuation — Bullish/Bearish resume using smoothed 9‑SMA, including a concise cross summary.
Momentum & volatility
- MACD zero‑line reclaim — Bull/Bear, confirmed & flashing, with “bars since negative/positive” diagnostics.
- SMA stack flips — Golden/Death Cross plus 50↔100 & 100↔200 flips, with prior→current stack state and a values line.
- ATR expansion/contraction — neutral wording, volatility burst/contraction classification, and context side (above/below Bollinger Basis).
Message extras (every alert)
- Timestamp — New York time with DST handling down to seconds.
- Values — Price, Basis, 50/100/200 SMA, MACD/Signal/Hist, momentum label, RSI zone, and a compact “Price vs MAs” line.
- Stop‑line guidance — tight/loose suggestion lines derived from 50/100/200/Basis/Prev‑LL anchors; one‑bar Gold pulses arm warnings and staged exits in strategy mode.
This software and all associated content are provided for educational and informational purposes only and do not constitute financial, investment, or trading advice. You should always consult with a licensed financial advisor before making any financial decisions. Alerts, education, backtests, and examples are hypothetical and do not guarantee future performance, and past performance is not an indication of future results. Trading involves risk—always consider execution quality, fees, slippage, and your risk tolerance.
Performance
Backtest strategy setup
- Initial capital: $10,000
- Entry sizing: 100% of equity per buy
- Pyramiding: 50
- Sell management:
- Sell 50% of the entry using a tight stop‑loss
- Manage the remaining position with a loose stop‑loss generated by the indicator
Backtests are hypothetical and do not guarantee future performance. Actual results depend on execution quality, fees, slippage, asset‑specific behavior, and adherence to the strategy.
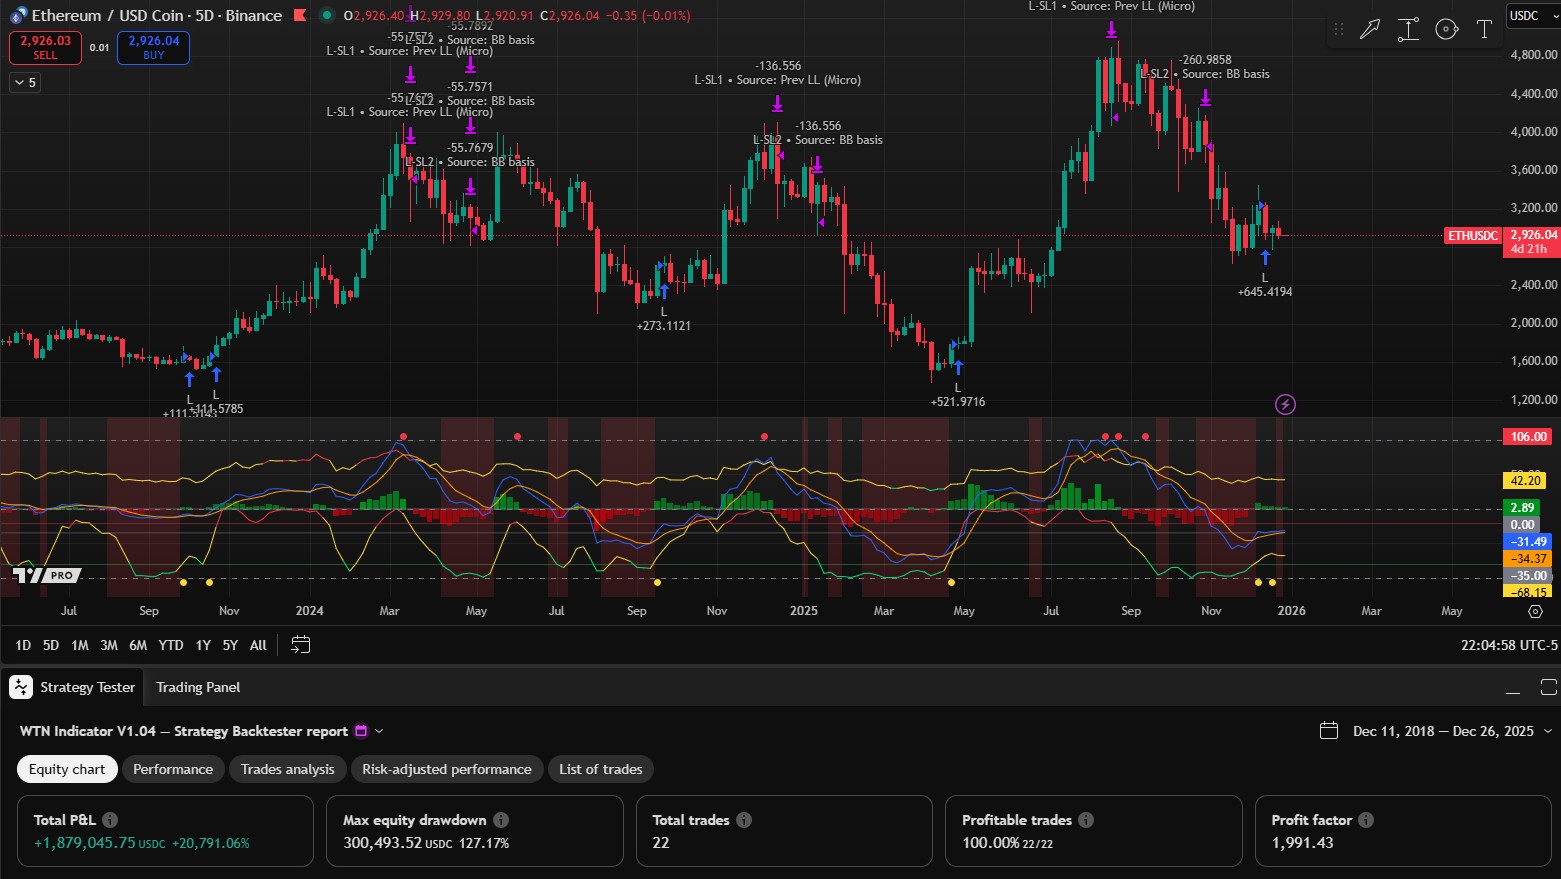
The backtest on the WTN Technical Indicator shows that the strategy started in 2018 buying ETH with a starting value of $10,000. Following the indicator resulted in 100% profitable trades (22/22) with a reported P&L of $1.87M in profits.
These results do not indicate future performance and there are no guarantees. Backtests are hypothetical and rely on assumptions about data quality, execution, fees, slippage, and adherence to the strategy.
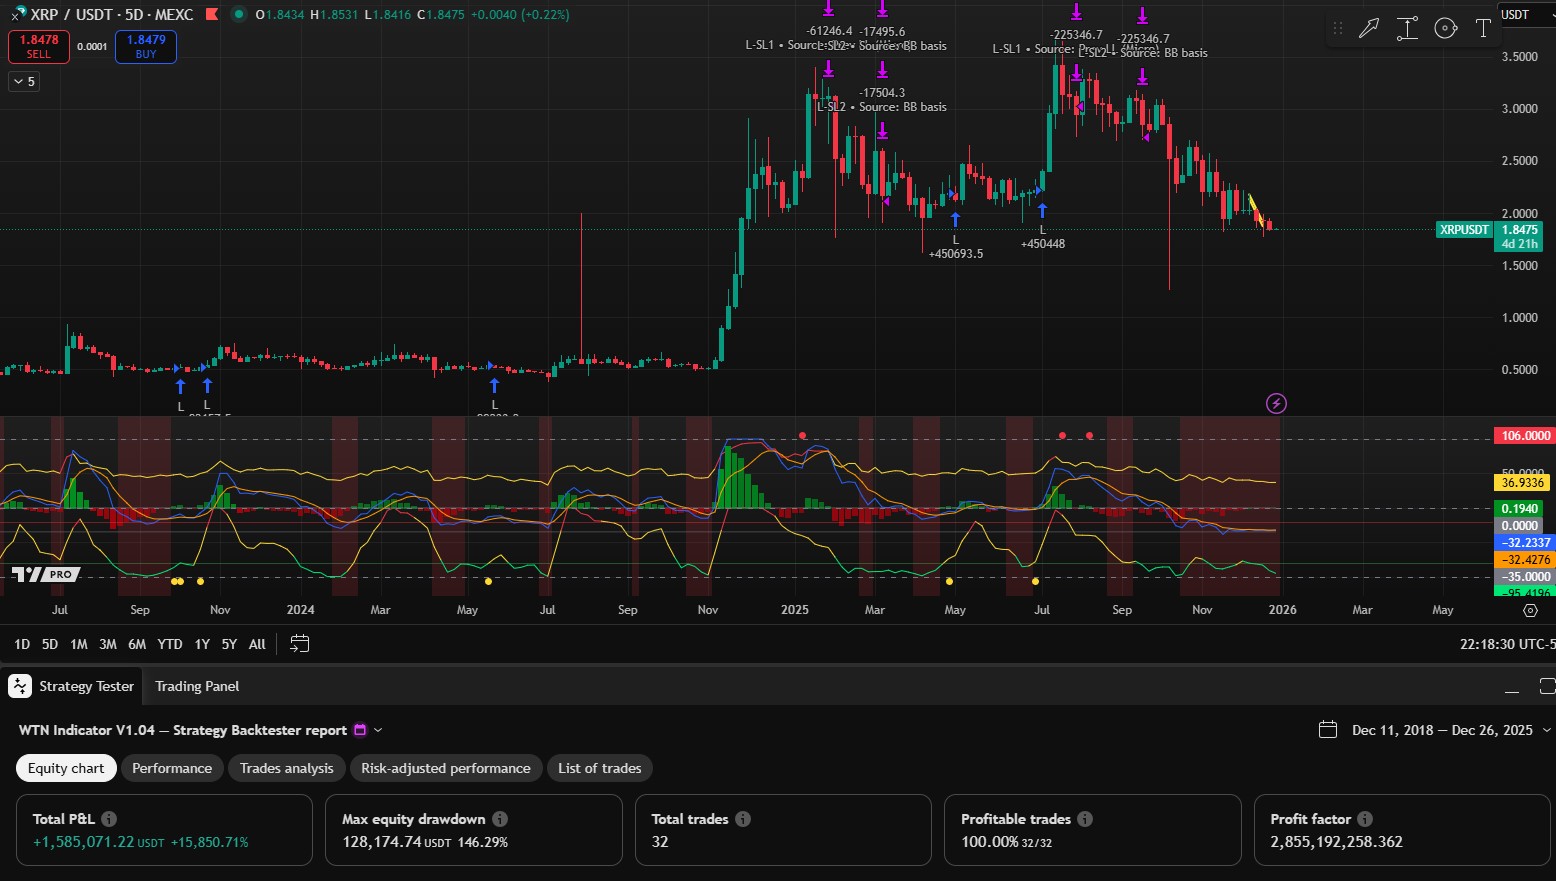
On XRP over the same period (Dec 11, 2018 – Dec 26, 2025), the backtest panel reports 32 total trades with 100% profitable trades (32/32) and a cumulative P&L of ≈ $1.585M. Drawdown and profit factor metrics appear in the report for context and risk assessment.
Backtests are hypothetical and do not guarantee future returns. Actual results depend on execution quality, fees, slippage, asset‑specific behavior, and adherence to the strategy.
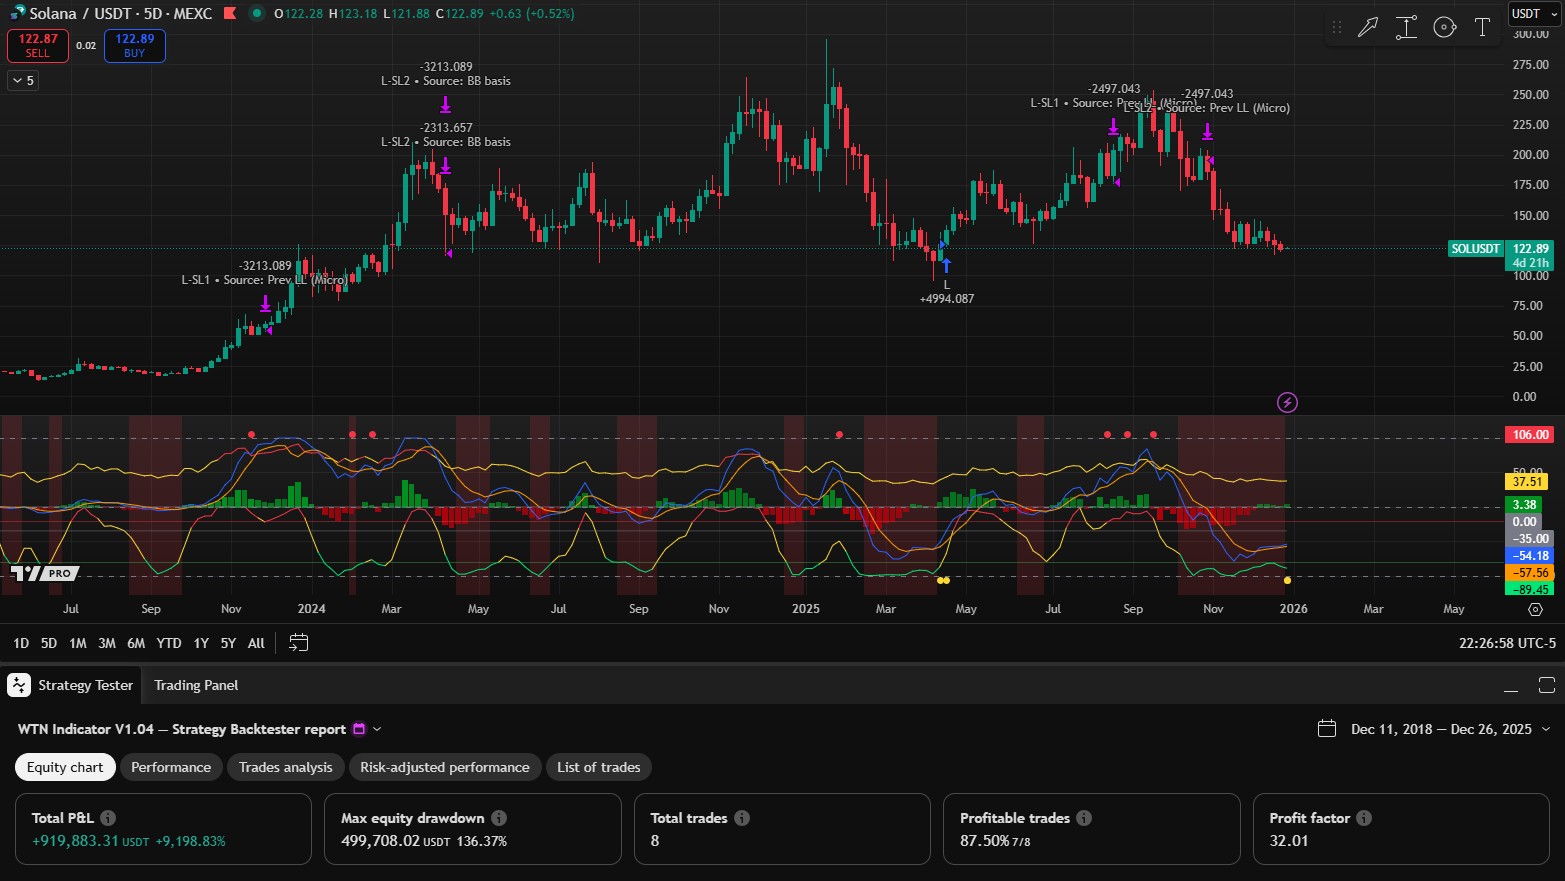
On Solana (SOL), the backtest report shows 8 total trades with 87.5% profitable trades (7/8) and a cumulative P&L of $919,883.31. The panel also reports a profit factor ≈ 32.01 and a max equity drawdown ≈ $499,708 (≈136.37%).
Backtests are hypothetical and do not guarantee future returns. Actual results depend on execution quality, fees, slippage, asset‑specific behavior, and adherence to the strategy.
Start with confidence
Use Green/Gold for progression; let gates handle context. Train with the free Suite for consistent practice.